Pages

Tuesday, March 18, 2014

A first look at the "37 billion mile" data challenge, with some maps

MAPC has put together a data set from MassDOT that consists of the entire Commonwealth's vehicle registration data (suitably anonymized), including odometer readings, and then summed it up in quarter-kilometer square blocks. I grabbed a copy of the data and plotted a few simple Google Fusion maps to check it out:


Household Vehicle Miles per Day

You can see that the data is presented in blocks that are 250 meters on a side. MAPC prepared an estimate of how many miles per day each household travels in one of their cars. That can range from zero, for households with no cars, all the way up to this one crazy person who apparently drives 646 miles per day. I have chosen a color scheme such that the miles driven is divided up into quintiles based on city of Boston map squares. A fifth of the Boston map squares fall into the category of "0 to 11.98 mi/day", the next fifth are "11.98 to 17.65", etc. Although the map shows regional data (and state-wide data is available in the complete set), I decided to focus the color scheme on Boston because I am most interested in the car-free and car-light households.


Vehicles per Household

The same largely goes for Vehicles per Household, which is obtained by taking the number of households in each map square and dividing it from the number of vehicles registered to an address in each map square. Note that "households" is defined as the number of households counted by Census 2010, and registered vehicles were geocoded into the various map squares but that process was not always successful. There have been some slight adjustments to the numbers, according to MAPC documentation, to account for the vehicles that could not be accurately pin-pointed. I will trust their models for now.


Car-free Household Percentage

The last one just highlights where the households with the least number of cars are found on the map. I don't think there are too many surprises here, especially for people familiar with my map based on Census/ACS data. The effect of the Green Line is pretty pronounced, it's easy to see the trace of Commonwealth Ave, Beacon Street, and Huntington/S. Huntington Aves. In fact, the abrupt end to blue-colored blocks just past Heath Street seem to indicate that the loss of the Arborway trolley has really taken a toll in terms of increased car ownership around Centre Street. Or maybe it was increased car ownership that led to the cutback. Another interesting pattern is around the new Fairmount/Indigo Line stations. Most of them seem to be near pockets of car-light or car-free households, even though the stations are relatively new. No doubt, that was a key motivation in the planning of the line.

Quick note on outliers: sometimes you may spot a square that is radically different from its surrounding squares. It could easily be a matter of small sample size, or just a local facility that is skewing the data. For example, a nursing home. Or the Four Seasons hotel, which seems to have about 170 vehicles registered between it and the Boston Public Garden. Sanity checks are always a good idea.

Friday, March 7, 2014

The need for station consolidation on the MBTA "B" branch, in one chart


Update: MBTA announces station consolidation public meeting, Oct 23rd.

Original Article:
A little while back, BU put together a Transportation Master Plan that included some detailed ridership data about the MBTA Green Line "B" branch. I somehow missed this appendix while looking through their master plan in the past. Thanks go to Eric Fischer for alerting me to my oversight.

The data include hour-by-hour breakdown of boardings, alightings, and line volume (the number of people riding through) for each of the surface stations Blandford Street through Warren Street, taken on a Fall 2010 day. It occurred to me that a station's importance is related to the number of people who use it, versus the number of people who would prefer to ride past it. This is also tied to the relative proximity of the stations. Multiple, closely spaced stations will divide up potential ridership and therefore, will mutually reduce the importance of each such station.

The four stations in the scope of the upcoming Commonwealth Avenue Phase 2A street rebuilding project are very closely spaced. They are some of the most closely spaced stations in the entire system, as they are placed on four consecutive city blocks approximately 730 feet apart on average. That is a 2-3 minute leisurely walk between stations. Perhaps only Back of the Hill and Heath Street are closer.

The diagram above is drawn to scale, and it shows how the stations are spaced relative to one another. Above the station names is a bar graph which shows the relative importance of each station, as measured by the number of people who use the station (boarding, alighting) divided by the number of people who ride through the station. It should come as no surprise to any frequent user of the "B" branch that Harvard Avenue is the most important station, by far, and that the four least important stations are: Babcock Street, Pleasant Street, St Paul Street, and BU West; the last being the most underutilized.

I believe that this diagram makes a strong, visual case for station consolidation during the upcoming Phase 2A project, in addition to station relocation to better accommodate signal priority. I would like to see the MBTA begin a public process, much like they did ten years ago, to work on implementing efficient station spacing for this section of the Green Line.

In addition to improving the experience for about 30,000 people, a shorter round trip time will save resources for the MBTA. If the scheduled round trip time for a train can be reduced by 6 minutes, then that means one fewer train is needed to operate the same peak schedule. That train can then be put to better use in other ways: to split it into more 3-car trains, to help bring back 5 minute frequency, or to send it out for much needed maintenance.

Even more savings are available if the MBTA finally implements all-door boarding and transit signal priority, but that's another discussion.

A quick note on the gap between BU West and BU Central: that space is mostly occupied by the Mass Pike trench, currently. The overpass of the Pike will be reconfigured as part of Phase 2B, and then I believe that BU has some air rights projects in mind. If station consolidation is properly implemented in Phase 2A, and if BU ever builds over the Pike, then it may make sense in the future to relocate BU Central further west. But until then, the most pressing issue is figuring out how to fix the Green Line problems within the scope of Phase 2A.

Tuesday, March 4, 2014

Yawkey Station and Fenway Park events

The new Yawkey Station is set to officially open -- finally -- on March 10th. It's a pretty big improvement over the old asphalt strip. And it will get service commensurate with its design: every train will stop there, which is one more than Back Bay gets. But I feel like there is a missed opportunity here. Everyone who rides the Green Line knows that on game days, when nearly 40,000 fans descend upon Fenway Park, the T is completely stuffed. Baseball games typically start just after 7pm which coincides with the pm peak. If you make the mistake of trying to use the Green Line in the Central Subway between the hours of 5pm and 7pm on a game night, you may not be able to board. I am, of course, very pleased that so many citizens and visitors choose to use public transportation or walk to get to the baseball game. I would say that the majority of the attendees do so, and that is to the great credit of Red Sox nation and the city of Boston; unlike the lunar-like surroundings of many other cities' stadiums, Fenway Park is in a walkable place.


Not Fenway Park!


To continue to encourage this trend, the MBTA ought to be looking at opportunities to increase capacity: especially as the remaining surface parking lots get developed, finally. Fixing problems on the Green Line is welcome, certainly, but won't come cheap or easy. It needs a power system overhaul and new vehicles, just to keep up with burgeoning ridership. But those are multi-hundred-million dollar items. Now, they are putting the finishing touches on a commuter rail station adjacent to Fenway Park, intended to help serve Fenway Park and its vicinity, but will they run the service that is needed to make the investment work?

A typical weeknight baseball game begins at about 7:10pm and lasts about 3 hours. Except, this is the Red Sox, so you have to figure it might go to four hours. Weekend games are known to generally start at 1pm, 4pm, 7pm, 8pm, or even 11am for the Patriots' Day game. The scheduled service is pretty miserably bad on the weekends (every 2-3 hours), so I will not focus on that too much.

Traveling from the west


The new schedule shows the following trips:
  • Train 528 departs Worcester at 4:40pm and arrives at Yawkey at 5:59pm
  • Train 530 departs Framingham at 5:15pm and arrives at Yawkey at 6:53pm
Those are usable for just about everyone with access to the Worcester/Framingham line, and they make every stop except for the three innermost Newton stops. Going home,
  • Train 543 departs Yawkey Station at 10:36pm
  • Train 545 departs Yawkey Station at 11:36pm and is the last train of the night
So, except for the very longest games, this could work. I did stay at one game, a few years back, until past 2am -- it happens -- but pretty much everyone who was time-constrained had left long before. From 7:10pm to 11:36pm is a 4:26 window but you have to factor about 20-30 minutes for people to escape from the Park itself at the end of games.

However, this kind of trip isn't very useful for decongesting the Central Subway. It's not a clear win over driving to Riverside ("D" branch) either, but that route gets pretty busy as well and there may be people looking for alternatives.

Traveling from the south side

This is where the new schedule had much more potential to take a load off of the Green Line and I think that it failed. The Green Line and the Worcester line are not exactly parallel, but they are close, and the Worcester line connects with the Orange Line, the Red Line, and numerous commuter rail lines. This could have offered an alternative travel path for many attendees, freeing up a bit of capacity on the Green Line.

Connecting between trains is a bit more of an ask, especially for people who are not typical riders, but it could be publicized and accommodated if the organizations would be willing to try. And certainly, there is a compelling offer: go this way and don't be a sardine on the overcrowded Green Line; it's cheaper and less aggravating than driving and parking.

However, the train times don't really work out:
  • Train 535 departs South Station at 6:40pm and arrives at Yawkey Station 11 minutes later.
  • Going back, train 540 leaves Yawkey Station at 10:47pm arriving at South Station in 10 minutes.
  • And, train 542 leaves Yawkey Station at 12:27am.
Getting to Fenway is okay, although train 535 is technically part of the peak and may be crowded already, but returning is absolutely fraught with peril. Both of those are "L" stops as well, so the train may leave early. Here's another problem:
  • The Franklin line has departures at 10:35pm and 11:50pm, totally missing the connection.
  • The last Fairmount train leaves at 9:40pm.
  • The last Stoughton train is at 11pm and the last Providence train departs at 11:59pm.
  • The last Needham train leaves at 10:30pm.
  • The Greenbush line only has a departure at 10pm, but who rides that anyway?
  • The last Middleboro train leaves at 10:30pm and the last Kingston train leaves at 10:40pm.
Basically, the 10:47pm train from Yawkey to South Station does not mesh well with any of the other line schedules, and even the most closely timed line -- Stoughton -- will be missed if there is a delay of a minute or two. And 10:47pm may be too early a departure for a Red Sox game.

So this isn't looking too great. On the other hand, the connection could still help Red Line riders, which is quite a large population. And with some changes, there is utility for Providence and Franklin line users as well.

A game shuttle

Providence train 822 arrives at South Station at 6:22pm which brings it in time to make a connection to the 6:40pm departure towards Yawkey. However, Franklin train 796 doesn't get there until 6:50pm, which is too late to connect.

However, at this point, the peak time is over and it may be possible to do something a bit unorthodox for the MBTA: turn train 796 quickly and send it out towards Yawkey, at about 7pm. It can skip Back Bay station and get there before the game starts. The empty train can then proceed to Beacon Park to turn back toward South Station. This gives you two things:
  • A one-seat ride for Franklin line riders
  • A second, game-night option for all others
I would even recommend simply not checking tickets on the Yawkey leg of the trip, in order to speed up boarding and make things run as smoothly as possible.

On the way out, a similar, special trip could be planned. A large consist could be staged and prepared to pick up passengers starting about 15-20 minutes after the last out of the 9th inning (within reason). You would not want to use DMUs for this purpose because this is exactly the sort of trip that the large capacity locomotive/passenger configuration is best for. That train would move to South Station, unload passengers, and then become a Providence or Franklin train, possibly even a special, additional trip.

Conclusion

So, would this all work? Well, I think it would be attractive to Red Line users who are probably sick of the crush at Park Street pre- and post-game. The commuter rail is a bit more of a stretch but with some ingenuity, and publicity, it might be possible to get some significant ridership: especially if there were guaranteed connections timed around the baseball game. When I was spending some months in the San Francisco Bay Area, I often rode back on the special "game trains" that were added to the schedule after Giants games. AT&T Park is only two blocks from the 4th and King terminal. Caltrain, as any rider knows, is far from the cleverest agency in the world. But those trains were generally packed with baseball fans. Now, it's easier when you only have one line to coordinate. But this is something the T ought to be able to handle. It might even be good practice for the future, when frequent DMU shuttles will make the idea of connecting between commuter rail lines somewhat less quixotic. To me, it just seems really strange to invest so much into this transportation infrastructure, and then not put it to use when the capacity is really needed.

Sunday, March 2, 2014

The perversity of the Beacon Hill historic district

Beacon Hill (the neighborhood, not the state house) is in the news this past week for the Beacon Hill Architectural Commission's (BHAC) refusal to comply with the Americans with Disabilities Act. Apparently, accessible pavers and handicap ramps, they claim, would mar the historic character of the neighborhood. Adam has some fine snark in response:
Yes, they would seriously detract from the hundreds of colonial automobiles parked on colonial asphalt underneath all those colonial Resident Parking signs when their drivers (garbed in breeches, no doubt) aren't busy stopping for colonial traffic signals and colonial stop signs.
Here's what Mark Kiefer, a member of the BHAC, and apparently the most oblivious person in the city, had to say about tactile strips which help the visually impaired:
“It’s a matter of the visual impact,” he said. “We don’t want prominent things people will see commonly to smack of modernity.”
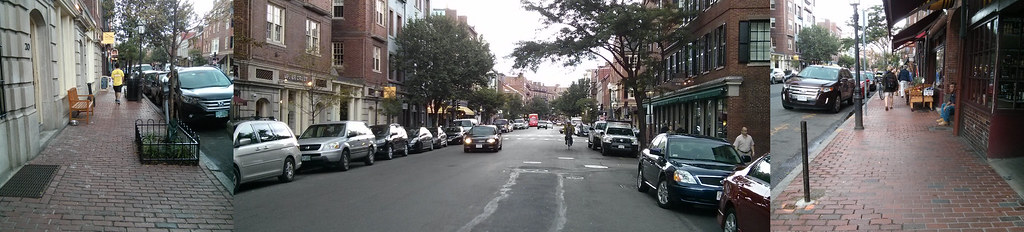
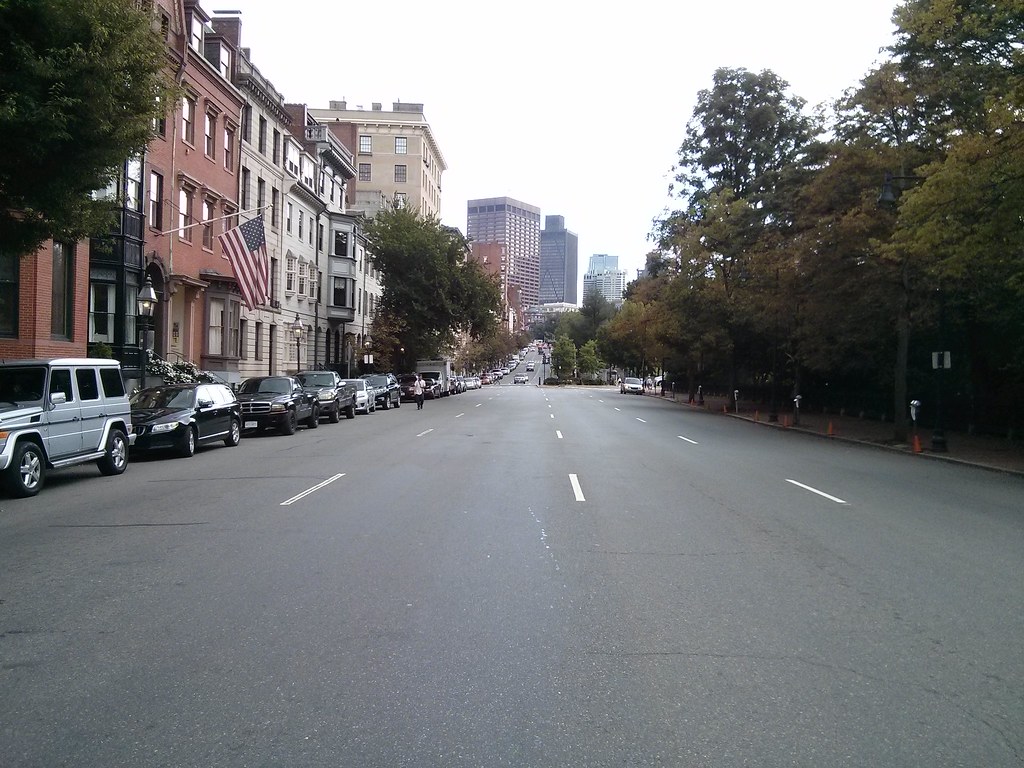
I happened to stop by Beacon Hill this weekend and it reminded me just how hypocritical, stuck-up, and snobby these BHAC cretins are. Here's Bowdoin Street, near the edge of the historic district, where a historic six-lane highway leaves hardly any room to pass by on the sidewalk. Apparently, this scene does not "smack" Mark Kiefer "of modernity" at all?

Historic SUV parked on historic asphalt next to charming lamppost blocking historically small sidewalk.
Approximately 75% of the street width is devoted to automobiles and fast-moving vehicular traffic. 
Bowdoin Street is 60 feet wide from curb-to-curb, easily enough for 4 travel lanes and 2 parking lanes. Or maybe it should be 4 horse lanes and 2 horse post lines. Because history. Anyway, BHAC is curiously silent about the heavy presence of parked cars and speeding vehicles on this street, while people walking try to squeeze by scattered obstacles and bottlenecks.

My impression of Bowdoin Street is that it is a half-victim of urban renewal, actually. It was originally constructed as a 40-foot street in 1727. I haven't found records of the widening, but, the far side of the street all looks like relatively newer construction with a historic-looking facade. If I had to take a guess, I'd say this is probably a victim of the Boston City Planning Board's insane zeal for street widening at any cost. Or, maybe Ed Logue and the BRA, since it is Government Center-adjacent. Whichever way it came about, here's how I'd describe it: not historic.

My post last year about the horrifically wide streets around the Public Garden also touches upon some Beacon Hill streets, notably Charles Street and Beacon Street:

Massive motorway -- tiny, oft-obstructed sidewalks. Ridiculous.

Nothing more historic than a four-lane highway. Right?
Beacon Hill does have some truly charming and wonderful streets. And even a historic feel, if you can overlook the omnipresent automobiles. But it's completely insane for the snobs at BHAC to be complaining about handicap ramps, unless they are prepared to stand up against all the BMW and Lexus owners who litter the historic streets. And while we're at it: modern plumbing and electricity too. Beacon Hill wants to pretend to be some kind of half-museum: pro-preservation, but only when it's convenient.

I understand the desire for historic preservation. I am, after all, a huge fan of narrow, medieval-style streets, such as those still found in some parts of Beacon Hill. I realize that historic preservation movements managed to save some parts of neighborhoods from the horrors of urban renewal and modernism. But there's a point where the movement becomes self-parody. This is one of those points: when cars are treated with more respect than people, the neighborhood has lost its way.

Remember the reason why historic preservation resonates with people: it's because the architecture of the latter 20th century is so terribly inhuman. Therefore, we cling to anything from the past, to buildings built during a time when designers still remembered how to relate to the human beings walking on the street. In a way, we're still stuck in the architectural Dark Ages, trying to feel our way out, trying to relearn was what forgotten during the modernist era. But one new idea that we do have right, in law if not in fact, is the notion that the city should be accessible to all its citizens.

Beacon Hill, get your streets in order. Put people first.

Tuesday, February 25, 2014

The MBTA Capital Investment Program FY15-19

MassDOT put out its capital investment plan (CIP) and the weMove Massachusetts plan recently, and the board voted on it a couple weeks ago. Actually, they voted on it at the board meeting on February 12th, while the comment deadline was February 14th, which makes it seem like they don't even maintain the pretense of listening to public comment. They did add some MBTA bus replacement funding based on the oral testimony from the public meetings, however.

The MBTA has a separate CIP with a comment deadline of February 28th though, and you can still comment by sending an email to cipinfo@mbta.com.

I recommend checking out the CIP FY15-19 document itself if you are interested in details about the system investment. There's some intriguing suggestions, such as the implementation of CharlieCard on Commuter Rail, or "identifying technology for proof-of-payment on the Green Line." I'm not entirely sure that this is new text, or if it's just leftover copy/paste from an old plan. But there's $16 million allocated to it in upcoming fiscal years.

On the other hand, there's also $308 million allocated to the disastrous South Coast Rail project, and $120 million for parking garages in Quincy, Beverly and Salem -- a highway benefit that directly hurts the MBTA's ability to attract real investment and ridership at its expensive stations.

South Coast Rail is especially pernicious because the final tally will be over $1.5 billion and it is only expected to accommodate about 5,000 riders. Those are optimistic estimates; some have ranged up to $2.1 billion and merely 3,000 riders. At a cost of over $300,000 per person, it is a boondoggle that absolutely dwarfs the Big Dig (~$100,000 per vehicle).

A recent blog post about the ridiculously high costs of American transit caught my eye with this paragraph:
Again, think of the consultant’s motivation. If they design everything to standard and it costs extra money, it’s not their money that gets spent. If they design something that doesn't meet standards, they potentially expose themselves to significant liability. What would you do? There’s a reason some consultants think the best project is the project that never gets built.
It occurs to me that this is the story of South Coast Rail: a consultant hand-out that won't ever get built. Think about this:

  • The $308 million is just for preliminary engineering and very minor track work (for freight).
  • The selected alternative requires electrification of the route, with commuter trains powered by overhead catenary. The MBTA does not operate such trains, has no facilities to maintain them, and has no plans to do so in the foreseeable future.
  • The South Coast Rail project has been a nebulous political football for decades, pumped by consultants all along.

So, there's a ton of money that gets spent on consulting work with very little construction to go with it; a service plan which is unimplementable; and a history of exploitation. To my eyes, this screams fraud.

Anyway, there's lots of stuff in it, so I recommend checking out the CIP and writing a comment by Friday.


Sunday, February 9, 2014

The last train home

Word got around at the end of last year that a new late night weekend service would be piloted this year on the MBTA. On weekend nights, trains and key bus routes will continue running past 1 a.m. with a final departure of the night around 2:30 a.m. from the downtown core. This initiative came from Govenor Patrick, and is reported to have a $20 million price tag. That seems a bit excessive, so it makes me wonder if the T is just taking this opportunity to bolster some schedules at other times of day as well, or adding some shifts to avoid being stretched thin at times. Either way, one thing that brings me concern:
The new late service, which will include the Silver Line, will be a one-year experiment. If it proves popular, it could become permanent.
I think that this foray into late night service is a very good thing (in fact, it does not go far enough, to help the late night service workers) and I am worried that we don't know what criteria will be used to judge the success of this pilot program, or what thresholds it will be expected to meet. What brought this to mind was a couple of good, recent articles on the topic of off-peak transit.

Far Beyond Rush Hour:
Metropolitan areas across the United States — whether their primary mass transit system is a metro rail or a commuter train or a bus network — are recognizing that city residents can't get by on great rush-hour service alone. They need frequent, reliable transit all hours of the day and long into the night.
The Real Barriers to Abundant, All-Day Transit Service:
The "guaranteed ride home." Peak-only services are risky. You can get trapped if you have to work late or leave early, so peak commuters value service at other times, too, even if they never use it. What's more, you won't use transit to get there unless you're sure you can get back, so the ridership at various times of day is interrelated. An empty evening bus is just a piece of an all-day offering whose availability throughout the day may be the real cause of its success.
The logic behind the need for good off-peak options also applies to very late night travel. You wouldn't want to use a transit system that could strand you at 8 p.m. and if you are out late, you don't want to use one that strands you at 1 a.m. either. But this doesn't necessarily correspond to heavy usage of the service past 1 a.m., although that would be good to see. Many people might choose to use the T to go out on the weekends, but even if they do end up coming home before 1 a.m., it is the existence of service after 1 a.m. that gives them the confidence to ride at all.

So I worry that if "success" is measured strictly by post-1 a.m. usage of the system, then it might not be reflective of all the ways the late night service is helping people. Especially if the MBTA does end up adding a surcharge to the fare: then additional people will be motivated to board earlier than 1 a.m., but they still do benefit from the commitment to offer service past 1 a.m., as a backup plan, just in case they miss the intended departure.

Having said that, there are many differences between 2005 and 2014 that could easily make up the difference between anemic usage and strong popularity. Use of the standard system (instead of replacement buses), better communication, promotion, awareness, and now real-time displays with data available online. These will all help increase ridership of the system that people already understand, late at night, with the confidence that only real-time vehicle location data can give.

Tuesday, February 4, 2014

Boston's narrow streets are safest for walking and riding a bike: wide streets are the most dangerous.

A wide street, Brighton Ave: 80 feet wide. Chung-Wei Yang was killed by a bus here.
I was reading an interesting Globe article on winter biking the other day when I spotted a sentence that was clearly tossed in there without much thought:
But urban biking does present risks, especially in Boston with its narrow streets and aggressive drivers. In 2012, five cyclists were killed in accidents — though none in winter.
This false, lazy sentiment about Boston's streets is unfortunately somewhat widespread. In fact, Boston doesn't really have many narrow streets. But, the narrow streets that Boston does have are one of its greatest advantages over other American cities.

In general, narrow streets are safer. From that study in Colorado:
“The most significant causal relationships to injury and accident were found to be street width and street curvature,” according to the report. “The analysis illustrates that as street width widens, accidents per mile per year increases exponentially, and that the safest residential street width is 24 feet (measured from curb face).”
Even 24 feet is fairly wide (enough for two fast-moving traffic lanes), but that town did not have any smaller streets to study. Even without the research, it's easy to see that the main purpose of wide roads is to make it easier to drive faster -- and speed is the biggest danger to life and limb. One of the reasons New York City is having so many problems with street injury is because, other than a few, relatively small areas of Manhattan and Brooklyn, that city is cursed with extremely wide streets.
Huntington Ave (courtesy: Google): about 95 feet wide. Kelsey Rennebohm was killed by a bus here.
Boston is luckier in that it escaped the foolish 19th century fad for wide streets with much less damage. The oft-noted "cattle paths" (not really) of downtown Boston are not so problematic. There are some cases where arrogant city planners from the twentieth century actually tore down buildings and parks to widen streets, and that was unfortunate. But luckily we managed to save most of Beacon Hill and the North End from their depredations and those neighborhoods survive as examples of people-scaled streets. We are also lucky that when the Back Bay was built, the streets were not created as big as New York's -- although they are still quite a bit larger than they should be, and in some cases, quite dangerous.
Beacon St and Charlesgate West: at least 100 feet wide. Kanako Miura was killed by a dump truck here.
But Boston's narrow streets pretty much end after you leave the downtown area, Beacon Hill, and the North End. Outside of that scope, Boston has many wide streets, and many streets that are much wider than they ought to be. While many of the residential side streets are 24-30 feet wide, I still see many drivers using them as high speed cut-through routes. But the truly dangerous streets are the main ones, which around me range from 50 feet, to 80 feet, up to even 170 feet from sidewalk to sidewalk.

Comm Ave at St Paul St (courtesy: Google): about 110 feet wide. Chris Weigl was killed by a tractor trailer here.
This is where the perversity of the Globe article quote comes into play: all of the people who were killed while riding their bike in 2012 were killed on very wide streets. Yet, the author blames "narrow streets." With such misinformation flying around, is it any wonder when people don't know better? Wide streets continue to be designed and built, on the premise that they are safer, when nothing could be further from the truth! One time, I asked an architect about why he was creating a new street that was so wide, next to a park where children play. He told me: but that's how it is in the South End, where I live! He didn't stop to think that the South End's wide streets were a danger and a drawback to living there.

Here's some more data. BPD identified several intersections which had the most crashes involving a bicyclist in 2012:

From Cyclist Safety Report 2013: most problematic intersections
Here are the street widths:

  • Beacon St at Massachusetts Ave: 50 feet
  • Massachusetts Ave at Beacon St/Comm Ave: 60 feet
  • Harvard Ave at Brighton Ave: 50 feet
  • Brighton Ave at Harvard Ave: 80 feet
  • Comm Ave at Harvard Ave: 160 feet
  • Huntington Ave at Belvedere St: 95 feet
  • Belvedere St at Huntington Ave: 60 feet
  • Columbus Ave at Cedar St: 70 feet
  • Cedar St at Columbus Ave: 26 feet
All of those streets are very wide except for Cedar St; a small side street that is one of the only ways to walk or bike between two densely populated residential sections of Roxbury, and requires crossing the very dangerous Columbus Ave between two very long blocks.

Columbus Ave (courtesy: Google): about 65 feet wide. A woman was struck and killed here on Christmas Eve.
I could keep going on and on, but I think I've made my point quite clear: wide streets are dangerous. Unfortunately, Boston has many wide streets, and it is very difficult to fix them once they are created. The best way to create safer streets is to build them narrower from the beginning. But in the rare cases where we have that opportunity, we are still building wide streets because people do not know or understand the danger. Engineers claim to try and anticipate future traffic growth, and they do not consider the costs of the wider streets at all. Fire marshals want wider streets and turning radii for their trucks, but they don't think about the people who will be killed or injured by those design choices. Architects like wide streets because it feeds their egos: they're always trying to build the next "grand Parisian boulevard" and, at least in the bad old days, they could care less about the human cost. Even the new planners, with their "complete streets", tend to favor wider streets: to squeeze more stuff onto. That is unfortunate. Complete streets should be seen as a way to reduce the danger of overly wide streets, not as an excuse to make the mistake of building wider streets from the start.

If we want streets to be safer in the future, what we really need is a program which encourages narrow, human-scaled streets, and also celebrates the narrow streets that we have inherited from the past.

Saturday, January 25, 2014

weMove Massachusetts: A disappointing, flawed plan for performance metrics that will repeat the mistakes of the past


This month, MassDOT announced a new plan called "weMove Massachusetts" which introduces the idea of using performance metrics to help plan investment in transportation. Sounds good, right? I was looking forward to reading about a scientific approach towards selecting projects that help people access the opportunities in their lives, while steering towards overall goals like "GreenDOT." But instead of that, when I read the report, I found the same bad old attitude that you also find at the Texas Transportation Institute. The main automobile measure is regressive. The sole metric for bicycle usage is almost completely useless. The transit metrics range from irrelevant, to poorly designed, down to outright worthless. There are no walking metrics in the report. Many of the metrics don't even involve actually measuring anything in the real world!

Metrics have consequences

Before I go into the specifics, let's take a quick step back and think about what we actually want out of our transportation metrics. There are two main ways of looking at transportation broadly, and both have their uses, depending on context: mobility vs accessibility.

Mobility measures the amount of traveling you are able to do: e.g.

  • How fast can you go?
  • How far can you go?
  • How easy is it to move around?

Accessibility measures the amount of opportunity that is open to you because of transportation: e.g.

  • How many jobs/needs/activities can you reach in a reasonable amount of time?
  • How many choices do you have about getting to your destinations?
  • How is your quality of life improved by transportation?

These are not completely distinct viewpoints. For example, you could increase the number of jobs available to you by improving the speed of transportation. On the other hand, you could also achieve the same by having the economy add more jobs within your existing range, or by moving to a region with more job density. The latter is, broadly and superficially, the way cities form.

However, choice of viewpoints does matter when trying to put together cost/benefit analysis for new transportation projects, and it is very important to choose carefully. A metric is a convenient number which tells you something useful, but it is also an intentional oversimplification which can lead you astray if not used judiciously. Unfortunately, our MPO has a history of abusing metrics, and traffic engineers are infamous for applying the wrong tools to our cities, causing terrible destruction in the process.

Is there an ideal general metric at all? I don't think so, but the closest one I believe is the last example I cited above: "How is your quality of life improved by transportation?" Ultimately, transportation is about giving you the ability to live your life as you see fit, to take advantage of the opportunities open to you, and to keep you safe while doing it. The problem with this formulation is that it is very vague and broad, making it difficult to quantify. That's intentional: "quality of life" means as many different things as there are different people, so there really is no one way to interpret this. Instead, when designing performance metrics that are more easily quantifiable, this principle is what you should be striving to justify your decisions by: how does your work help people live the life that they want to live?

Without further ado, I will jump into the "weMove Massachusetts" report and its many flaws:

Pavement, Bridges


I've grouped these two together because they have a similarity: obviously you don't want roads to crumble or bridges to collapse. But, the metrics assume that the status quo is sustainable and desirable, and all that is needed is an influx of money to repair what we have. A very, very large influx of money: $544 million a year on Pavement and $447 million a year on Bridges. That's a billion dollars a year for what will basically only benefit motor vehicle modes. This is not to deny the need for such repairs or such infrastructure. We need some of it. But do we need ALL of it? There should be some cost/benefit analysis applied to the two largest line items in the transportation budget. These metrics do not enable that. There is no consideration given to whether a lane diet might be a better way to go, for safety and money-saving purposes. And there is no consideration given to whether an overpass should be removed instead of rebuilt, even though 1950s traffic levels on it long ago disappeared. Is every square inch of asphalt sacred? Must we continue to perpetuate the mistakes of our forebears, at any cost, without thought?

Mobility


This metric is one of the worst in the document. It's basically lifted straight from the highway-crazed Texas Transportation Institute. Sure, this metric is fairly easy to quantify, but it reduces the whole notion of "mobility" down to one, highly confounded number: hours of delay per 1,000 miles traveled in a private vehicle. To understand why this is a bad metric, even from a driver's standpoint, consider the following tale of two commuters, Alice and Bob:
Alice lives in Waltham and works at an office near Rt 128 in Waltham, about 2 miles away. Under ideal conditions, her commute travel time is 5 minutes by car. However, under typically congested circumstances, it usually takes her about 10 minutes by car.
Bob lives in West Stockbridge and works at a shop in Westfield, about 40 miles away. Thanks to the sparse population, Bob can almost always drive 60 mph from start to finish, for a commute travel time of 40 minutes each way.
I cannot speak for the relative happiness of Alice and Bob, since it would depend on their (fictional) personalities. However, I can point out that Alice only spends 20 minutes a day commuting, while Bob spends 80 minutes a day just getting between home and work. Yet, according to this "mobility" metric of MassDOT, Alice is suffering terribly from delays, while Bob is doing great. Assuming 250 working days per year, Alice puts in 1,000 VMT/year for her commute, and experiences "delay" of 41.6 hours/year.

Viewed through the prism of this mobility metric, the DOT would rate Alice's commuting experience as being miserable, slow, and hellish. But that doesn't make sense from a common sense perspective. Alice only has a 10 minute commute! I bet most people would love to be in her situation, rather than being stuck in a car slogging it out 40 minutes each way. The DOT's metric is completely at odds with the principle of "improving quality of life." Not only that, the metric completely ignores all other modes of transportation. Two miles is not that far. That could even be walkable on a daily basis. It's easily bikeable within 15 minutes. If Alice is the sort of person who values getting exercise to and from work, it could easily be made possible. Or perhaps she would rather take a bus, the 70A, and do some reading on the 15 minute trip. Bob has none of those options: he is a captive car commuter. The only option he has is to car pool with someone else. But the metric doesn't even care about that: since it measures vehicle-delay rather than person-delay, your passengers may as well not exist.

The story of Alice and Bob is a bit too neat, obviously: in the real world, there are many other factors. But it's meant to illustrate a point: the mobility metric chosen by MassDOT is aimed in the wrong direction. The metric of "delay per vehicle-mile" is not designed to produce good transportation outcomes for people, but rather, to produce more funding for expensive road-widening projects which line the pockets of connected contractors and please the egos of highway engineers. The footnote to this metric tells it all:
Funding for mobility projects includes any projects that will increase roadway system capacity such as additional lanes, bottleneck removal, intersection improvements, etc.
MassDOT will claim that Alice is "suffering" from tremendous delay as justification for widening the streets in her neighborhood, installation of fancy traffic engineering techniques such as grade separation and complicated traffic signal phases. All of which will degrade the quality of life in her neighborhood. To be fair, in this day and age most of that will be shouted down by commuter opposition, but this is the same kind of metric that was used to shove these kinds of "improvements" down the throats of our communities in the past. More insidiously, planners will use this delay metric as justification for furthering suburban sprawl, instead of creating compact, walkable neighborhoods. The "delay per vehicle-mile" metric is complete garbage and thoroughly inappropriate for an agency which claims to be about promoting "smart growth" and "green travel" mode shift.

Safety


Safety is important. Everyone knows that. But, this particular way of doing it is an example of a metric which sounds good at first, but is actually quite mediocre, or downright dangerous, when you look at the details of how it is actually implemented. Why is there a focus only on intersections and interchanges. That seems strange. Although those are certainly higher risk locations, crashes can happen at any place. Why the restriction? The answer is found in another section which fills in some of the details:
Roadway safety is typically measured by the number of crashes. Crash rates cannot be easily projected into the future using the types of performance curves applied to other highway metrics. Therefore, safety performance was measured by the number of high-crash locations that can be improved over time for an average cost of $500,000/intersection.
So basically, they claim that they cannot get a good metric for "crashes prevented per dollar" and therefore, as a proxy, they will just count the number of intersection projects that can be funded, assuming half-million dollars each. Here's a litany of problems with this approach:

  1. There's nothing about "intersection improvements" which necessarily implies better safety.
  2. DOTs have a history of making "improvements" that make streets more dangerous for walking and biking. For example, street widening is sometimes considered a "safety improvement" even though it will end up producing more injuries, particularly to vulnerable road users.
  3. The real danger to safety comes from speeding vehicles. Again, "intersection improvements" says nothing about this, and the metric is completely mum about speeding elsewhere on the street.
  4. The metric encourages spending money on intersections and interchanges, but it does not actually measure whether that money was spent in a worthwhile way.
  5. It assumes that spending a half-million dollars is all that you need to do to "fix" an intersection.
  6. Severity of crashes is not considered at all. If you had to pick a design based on safety consequences, which would you select? (a) One person will die each year in a severe crash, or (b) ten people will be slightly injured a year in minor crashes. Obviously, zero injuries or deaths is best, but if you had to choose, then I think that (b) is a much better outcome. The metric considers none of that.
If you are going to adopt performance metrics, then you should actually go out and measure something in the real world. This so-called "safety metric" does not do that: instead it simply divides the amount of money available by the number of intersections, and calls it a day.

Bicycling

Behold, the only bicycle-focused metric in the entire report. The main mobility metric only focuses on cars, so this one should partially make up for that, right? Right? Yeah right. This metric is the first one in the report where you start to think that this whole document is really just a long, boring joke. If you try to consider it, there are a variety of ways you might go about quantifying bicycle performance (not endorsing any particular one): bicycle-miles traveled, % mode share bicycling, % population that owns a bicycle, % population that considers bicycling, number of comments on the Internet complaining about bicyclists, etc. What all these metrics have in common is that they involve making measurements in the real world: something must actually be counted, a number that cannot simply be conjured out of thin air.

This is in stark contrast to the proposed MassDOT metric: completion % of the Bay State Greenway, a network of off-street cycle paths. The DOT's metric is computed by looking at the budget documents and comparing whether or not the Bay State Greenway is funded under both budget scenarios. Since it is, the metric is set at 0% from now until the end of time. The genius who put this one together probably thought he or she was pretty clever to insert a "performance metric" which required a grand total of 30 seconds of work behind a desk, and will never need to be revisited again.

Complete and utter failure. Secretary Davey, this is a disgrace.

Walking

Just kidding. There are no walking metrics in the report. Well, I suppose you could pray that the "Safety" metric will bring "intersection improvements" that actually benefit pedestrians, and that the "Mobility" metric does not end up destroying the walkability of streets which used to be safe before the traffic engineers got their hands on them.

Transit

The tone of the report changes once it reaches the transit metrics. Prior to this, the metrics were somewhat broad or simplistic, but the transit metrics are very precisely chosen. Unfortunately, they are chosen rather poorly for planning purposes. I was told by some MPO staff that the MBTA was responsible for their metrics, and that does seem to be the case because these metrics are largely only of interest to someone working in the T's maintenance department. Since there are so many, I will group a bunch together and address them at once:
  • MBTA Bridge condition: the % of bridges that are in state of good repair.
  • MBTA Elevator/Escalator condition: the % of elevators/escalators that are in state of good repair.
  • MBTA Station Accessibility: the % of stations that comply with the Americans with Disabilities Act and the MA Architectural Access Board standards.
  • MBTA/RTA Bus and Train performance: the % of vehicles in state of good repair.
  • MBTA Signal performance: the number of annual signal failures.
All of these metrics are important -- to the people in charge of maintaining the system. However, these metrics are fairly irrelevant to the average customer. Reliability is important to the customer, certainly, but we don't go through the trouble of providing public transportation because we really like to do bridge or signal maintenance: the purpose, the reason for existence of the system, is making transportation available to people. People want to know that when they show up at a train or bus station, a vehicle will arrive in a reasonable amount of time. They want a system which gets them where they need to go, which gives them access to the city region and all of the opportunities contained within. Specific "state of good repair" statistics are part of the internal implementation of reliability. I suppose it's fair enough that they are being open about it and including it in the report. Fine. But then, where are the metrics which actually measure what people want out of a public transportation system? Not present in this report. Maybe the closest is another maintenance statistic:
Again, we have a performance metric based on delay, like what cars get. Good? Not quite. One improvement is, at least in this case, positive values don't imply a need for highly destructive road widening, since that is not on the table. So, improvements to delay are probably all upside, no downside other than cost. What else could be wrong? Well, it's another case of the same disease which seems to periodically infect planning at the Boston MPO and the DOT: vehicle-itis, the curious syndrome in which transportation agencies forget that their job is to help human beings, and instead focus entirely on pieces of steel and fiberglass.

This metric, like the mobility metric before, only focuses on the delay to vehicles, rather than people! In the other case, you might shrug it off because the average car only carries a few people at a time (although that attitude still screws over carpools). But it is huge loss when you neglect to account for the fact that a train could easily be carrying over five hundred people who are all delayed when the vehicle is delayed. The next time the Red Line breaks down, think about this: the MBTA, MassDOT, and the Boston MPO have all committed to the belief that your time, as a transit rider, is only worth 1/500th the value of anyone who happens to drive alone in their car.

A lot of perversity about our transportation system can likely be explained by this attitude:
  • The ever-increasing insertion of delays into the routine of T travel. From completely pointless, customer-loathing tactics like "Front Door Only alighting," to random "safety stops in the middle of tunnels" that are never fixed, to schedule management that hasn't changed since the early 20th century, to deferred maintenance up the wazoo, it's all part of a culture of not caring about the riders on-board the vehicles.
  • The continuing refusal to use signal priority for transit vehicles on the surface. Both Beacon St and Huntington Ave have the technology installed to do it. But the MBTA can't be bothered to implement this modern technique which is used all over the country and the world. In their eyes, a train with 300 people on board is not worthy of causing ten seconds of delay to a precious private automobile.
  • An almost complete lack of bus lanes outside of the gimmick lanes on Washington St -- which don't extend into the part of the city where bus lanes are desperately needed. This one's on BTD as well, but the MBTA should be pushing hard to improve the ridiculously slow speed of its buses.
  • The achingly slow turnaround time on the barest of improvements. The key bus route improvement project took about three years. Not because it was hard (it's not). Not because it was expensive (it wasn't). But because nothing happened for two years and then finally bus stops started getting moved, and painted in the street, within a few months at the end of last year.
  • The truly pathetic state of some of the stations, particularly on the surface, where there's nothing more than a few feet of asphalt with cars zooming by, inches from your body. And that's on a section of roadway that was rebuilt relatively recently!
  • The fingernail-pulling it takes to get sidewalks, crosswalks and bus stops shoveled clear of snow around here.
Choosing good metrics for transit is not easy, as it depends on the context and what you are trying to accomplish. But you cannot reasonably plan a transit system without using metrics which count people. Some examples of useful mobility-style metrics might include, but are not limited to: boardings per mile, net cost per passenger, average passenger load, or number of people unable to board vehicle due to crowding. Some examples of useful accessibility-style metrics are: number of jobs available within a 30 minute transit trip, number of people within a 5 minute walk of a frequent transit stop, number of people with disabilities who successfully navigate your fixed-route system, or percentage of riders who claim [dis]satisfaction with the transit system.

Conclusion

I know that I have been a bit crass about the problem here, but it is only because a strong tone is necessary. The "weMove Massachusetts" plan is terrifyingly terrible. It represents a large step backwards, encoding 1950s-style thinking about highways into a document which pays lip service to "smart growth" and "green travel" but does nothing to promote either. It is so bad, that I can only recommend one course of action: rip up the "weMove Massachusetts" document and start over from scratch. This time, choose empirical metrics which require real-world measurements, categorize them under either "mobility" or "accessibility," and justify why the people of Massachusetts should care about the metrics. I propose that the guiding principle be: "transportation investments that improve the quality of life of people in the Commonwealth" but I am open to suggestions.

I also want to add a note about GreenDOT: supposedly, it is a goal of MassDOT to triple the mode share of walking, bicycling, and taking public transportation. This report talked about that goal but, like with many other things, did not really go into any significant detail about it. However, I did hear from MPO staffers that the metric used will be "person-miles" for each of the "green modes." In other words, the Commonwealth of Massachusetts will either seek to encourage three times as many people to walk, bike, and ride transit; or, the Commonwealth will seek to force all current walkers, bikers and transit-riders to travel three times as far as they do today. According to the metric, either one works. Okay, that sounds a bit ridiculous, but that's because "person-miles" is not a good metric for walking, biking or public transportation in cities. If you want more details, read those links, but suffice to say: there's no public good served by forcing people to walk, bike or ride buses further and further away. Distance is not a virtue in itself.

I just wish that the people who put together metrics at our departments of transportation, and our organizations of planning, would put in even an ounce of thought into their work.

For more reading on metrics, and mobility vs accessibility, I recommend this paper by Todd Litman.

Monday, January 20, 2014

The term "jaywalker" is a slur

Excerpts from Peter Norton's book, "Fighting Traffic:"
When motorists first intruded upon city streets, annoyed pedestrians found epithets for the more aggressive ones. Some called them "joy riders," others "speed maniacs." Both terms connoted irresponsibility and a reckless disregard for the rights and safety of other street users. In 1909, for example, joy riders were motorists who abused their "power of life and death" over rightful but weaker occupants of streets: "pedestrians, ... the aged and inform, ... children playing in the streets"; in 1912 they were "automobilists" whose "aggressions" intruded upon the rights of pedestrians "to the very great danger of children and aged people." Both views reflected the unspoken assumptions of their time: that people on foot, including children at play, had a rightful claim to street space. 
Motorists replied with epithets of their own. They hit upon the most effective one early: "jaywalker." A "jay" was a hayseed, out of place in the city; a jaywalker was someone who did not know how to walk in a city. Originally the term applied as much or more to pedestrians who obstructed the path of other pedestrians---by failing, for example, to keep to the right on the sidewalk. As autos grew common on city streets, jaywalkers were more often pedestrians oblivious to the danger of city motor traffic. According to one early, more general definition (1913), jaywalkers were "men so accustomed to cutting across fields and village lots that they zigzag across city streets, scorning to keep to the crossings, ignoring their own safety" and "impeding traffic." 
Overworked police "cornermen" soon applied the term to pedestrians who ignored their directions. By 1916, "jaywalker" was a feature of "police parlance." Police use modified the word's meaning and sparked controversy. "Jaywalker" carried the sting of ridicule, and many objected to branding independent-minded pedestrians with the term. In 1915 New York's police commissioner, Arthur Woods, attempted to use it to describe anyone who crossed the street at mid-block. The New York Times objected, calling the word "highly opprobrious" and "a truly shocking name." Any attempt to arrest pedestrians would be "silly and intolerable."
Fast-forward one hundred years. Yesterday, an elderly Asian man was brutally attacked by NYPD officers. The reason? "Jaywalking." Earlier the same day, in the same vicinity, one pedestrian had been slain after being tossed by an ambulance into the path of an SUV, and another person was killed by a tour bus. The previous week, a taxi driver killed a 9 year old boy who was walking with his father in the crosswalk. No charges were filed against drivers in any of the cases.

NYPD bloodily beats an 84-year old man for crossing the street. (source: G.N. Miller/NY Post)
Prior to the 1920s, it was generally held that the public streets were public spaces, and that all people had a customary and ancient right to use them, with or without a vehicle. Terms like "jaywalker" were slurs invented by people expressing a crude emotional state, but it was not yet an epithet enshrined in law. During and after the 1920s, due to the lobbying efforts of organized automobile groups, the public figures became more comfortable with invoking slurs such as "jaywalker" in a more formal setting. This effort to redefine streets as a place only for cars, led by groups promoting the automobile, was followed by decades of declining freedom for children, pedestrians and other non-motorized users of the street.

In recent decades, efforts to reclaim freedom of the city street for pedestrians have boiled up in a number of cities around the country. But the old laws are still on the books, the laws that use slurs like "jaywalker" and which confine the pedestrian to tiny pieces of the public right of way, with limited mobility, facing danger on all sides. In proper, walking cities like Boston and New York, those old regulations have generally been held to be relics of the bad old days, mere curiosities, detritus. Only uncouth, unwalkable places such as Los Angeles, or most of Florida, would actually discriminate against pedestrians like so.

Alas, the old regulations do still have bite, especially when combined with the unaccountable, irresponsible arrogance of a police force such as NYPD. Although I have more faith in BPD than NYPD, the events of this weekend can show how rapidly things can turn for the worse, even in the strong walking culture of an Northeastern city. It is time to remove all laws and regulations on the books which discriminate against pedestrians, and it is long past time for slurs such as "jaywalker" to be deemed unacceptable jargon for use in formal, legal documents or pronouncements by public figures.

For Massachusetts, it could be relatively simple, since most of the anti-pedestrian language is found in the Code of Massachusetts Regulations, which are rules created by administrative department under a general authority granted by the legislature. In this case, it is 720 CMR 9.09, which, thankfully, actually refrains from using the term "jaywalker" itself. However, the existing code was written with the primary goal of speeding up cars and trucks traveling along streets, and segregates pedestrians in order to get them out of the way. The code was written at a time when the pedestrian was considered an obstacle, and a barely tolerated user of the street. The regulations should be reformed to put the safety of the pedestrian first and foremost, while preserving the traditional right of access to the public right-of-way that is entitled to every person. The upshot will be primarily one of calming streets, slowing traffic to reasonable speeds in city neighborhoods, and creating a much more relaxed, freer environment where drivers and pedestrians can share the use of our public streets.

This kind of environment was, actually, the direction that motor vehicle regulation had been headed in the 1920s: before automobile groups prevailed over safety councils in the halls of power. There are many quotes in Norton's book like this one:
Police and judicial authorities recognized pedestrians' traditional rights to the streets. "The streets of Chicago belong to the city," one judge explained, "not to the automobilists." Some even defended children's right to the roadway. Instead of urging parents to keep their children out of the streets, a Philadelphia judge attacked motorists for usurping children's rights to them. He lectured drivers in his courtroom. "It won't be long before children won't have any rights to the streets at all," he complained. As the usurper, the motorist, not the child, should be restricted: "Something drastic must be done to end this menace to pedestrians and to children in particular."
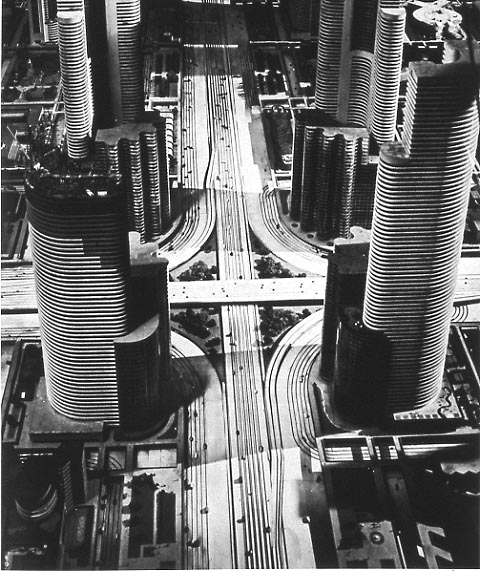
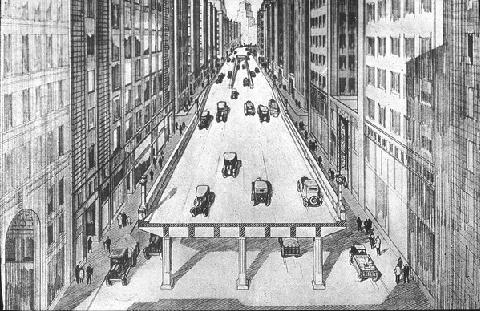
By 1930, the motoring enthusiasts succeeded in enshrining "speed" as the foremost goal of street regulation, and placated safety advocates by suggesting a system of grade-separated highways and elevated pedestrian sidewalks which would entirely segregate cars from walkers (and bikers). After nearly nine decades of experience, and millions of deaths, we know that the realities of such fantasies are horrific for pedestrians and the city, to the point where several decades and untold billions of dollars have been spent ripping down the elevated freeways that were built.
Futurama exhibit at 1939 World's Fair ("City of 1960!") by Normal Bel Geddes

Artist's conception of elevated highway in Boston, 1930 (source)

Reality of the Central Artery (source)

It seems to me that if we are repeating the struggle of the 1920s between motoring interests and city interests, then we should take heed of the lessons of the twentieth century. Grade separation does not work for city streets. The promotion of vehicle speed, over the safety and access of pedestrians, only leads to desolation and abandonment of the city. The police cannot be trusted to judiciously apply "pedestrian law" and it doesn't make sense anyway: nobody was ever killed by a speeding pedestrian.

The more appropriate path is the one that was unwisely abandoned in the 1920s: the recognition that on city streets, speed is anathema to safety. Socially, many people are coming to realize that the old way is the best way forward: the proliferation of safe street, complete street, livable street movements is testament to that. However, the law still enshrines the dangerous twentieth century dalliance with speed at the expense of safety, and the slur "jaywalker" is still considered valid jargon for use by public figures. It may be the only such slur. Changes in concrete take time, but changes in terminology need not.

Police resources should not be used as a weapon against walking. For one thing, it strikes at the heart of the city, which is the vitality of its walking population. For another, pedestrians have enough danger to contend with already: protecting themselves from heedless motor vehicle drivers who cannot be bothered to respect even the little scraps of street space the law grants to people on foot. Deploying police action against pedestrians is radically unjust, and an all too tempting case for abuse, as the NYPD demonstrated yesterday. After all, catching pedestrians is a lot easier than catching speeding motorists, because pedestrians pose no threat to anyone's safety. The penalty for misjudging the speed of a vehicle is already quite steep---injury or death---and a citation is simply heaping insult on top of that. On the other hand, everyone knows that the vast majority of reckless driving goes unpunished, and the penalty relatively toothless in comparison with the potential devastation wreaked.

Boston, in particular, has a major difference from many other counterpart cities: the extensive usage of "beg buttons" and the very poor programming of pedestrian signals and infrastructure. The status of Boston as a "walking city" is despite the infrastructure: because people have learned to routinely dismiss the signals as untrustworthy. Even BTD Commissioner Jim Gillooly has admitted that he does not really expect pedestrians to wait for the signal, and he personally does not either. So, Boston's status as a good walking city is largely dependent upon the choice of the powers-that-be not to enforce the anti-pedestrian regulations on the books.

New Mayor Marty Walsh has had a mixed record in his former job, the state legislature. While he has promoted bills which would reduce speed limits in urban areas, he has also pushed for doubling of penalties upon pedestrians, quite a regressive measure. Going forward, I hope that he chooses to distinguish himself from Mayor Bill de Blasio, by choosing methods of bringing safety to our streets that do not include pedestrian discrimination: walking should not be a crime, and making it so will only lead to conflict and disaster.

Saturday, January 18, 2014

Walk audit of Union Square, Allston and suggestions for the future

Union Square, Allston. The view from the Twin Donuts shop, facing east.

(Updates in bold posted 12th November 2015).

Let's take a look at Union Square in Allston, a vibrant neighborhood of the city of Boston. This is the convergence of several busy streets, a transit hub for buses, a retail district, with an elementary school and plenty of nearby residents living within a few minutes walk. I will call this a kind of "audit" because it is based on my observations, as an outsider. The audit uses timings from a weekend study. The main difference between a weekend and a weekday here is length of the full cycle: 90 seconds on the weekend, 110 on the weekday. Adjust accordingly.

Union Square, landmarks and street names. All satellite imagery courtesy Google.
Click on it for larger view.
Key points from below the jump:
  • The "level of service" given to the Union Square intersection, by the New Balance transportation study, is "D" (35s to 55s average delay/vehicle) during weekday a.m. peak and "E" (55s to 80s delay/vehicle) during p.m. peak and Saturday peak. "D" is considered normal in cities.
  • Traffic levels have declined by about 5-6% here since 2002.
  • An examination of the signal schematic (below) shows that for cars, no direction of travel has to wait more than 72 seconds to be given a green phase, on a weekend.
  • Yet, the minimum time for a pedestrian to cross Union Square (north/south), legally, is about 100 seconds, if you happen to arrive at the intersection at the optimal moment in the cycle.
  • For the less lucky, the expected crossing time is about 145 seconds with a worst case of about 190 seconds.
  • For the less capable walkers, the worst case is about 258 seconds. If you happen to be elderly, or a young child. the city expects you to wait 4.3 minutes to cross 95 feet. That's a rate of 0.25 mph.
  • The green right turn arrow given to traffic moving eastbound from Cambridge Street is in direct conflict with a walk signal for people crossing between the school and the fire dept station (see picture below).
  • The 21 seconds of walk phase given to the 110' crosswalk of Cambridge Street between the Jackson Mann school and Twin Donuts is not enough time for a healthy adult, much less a person with disabilities or a child going to the school.
  • There is no crosswalk marked at the Hano Street bus stop, despite heavy ridership. Instead, the city put up a new sign telling pedestrians not to cross there, in response to a tragic crash.
  • In the long-term, a Poynton-style redesign should be seriously considered, with a shared space design such as a single-lane roundabout (or similar) completely replacing the traffic signal-controlled intersection. All users of the intersection would benefit, as would the surrounding neighborhood.